Translate This Page
We are engineers and one of the most important basic principles of engineering is accurate measurements. If you get your measurements wrong, then quite literally things can start to fall apart. So one thing that we find interesting about the situation of the large grazers in the OVP is the numbers. And there, we have to say that we are disappointed.
We have the greatest respect and also a lot of sympathy for the people who try to count the number of Heck cattle, Konik horses and deer in the OVP. It can't be easy: they move around, they stand behind each other, they lie down, they hide behind bushes and amongst the trees etc. In order to try to reduce the errors in the counting, it is repeated to give a total of up to three results which are averaged. However, there are a number of factors that can affect the counting: changes in the weather, the time of day at which the count is carried out, movement of the animals between areas, births and deaths and even just changing the observer can have an effect too. These limitations are known and this publication, in Dutch, delves a bit deeper into the subject and specifically mentions the OVP. http://library.wur.nl/WebQuery/wurpubs/fulltext/274176
It's clear that the researchers don't expect to arrive at a figure that is accurate to the last animal. They just expect to be able to establish trends in the size of the population. Therefore we are not so impressed in the way that the figures are presented in the annual reports (jaarrapportage) of the SBB https://www.staatsbosbeheer.nl/over-staatsbosbeheer/dossiers/oostvaardersplassen-beheer/links-en-downloads and the way in which they have changed over the years. This is how the figures were presented in the 2011 report covering the period 2010/2011:
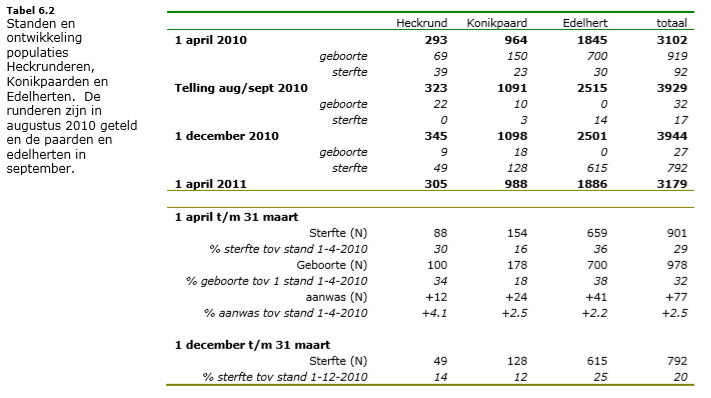
Let's first look at the precision of the reports: in the first two the numbers are given precisely: 293, 964, 1845 etc. This is not justified, because of the inaccuracies associated with the counting methods. The third report is a bit better because now it is showing numbers rounded to the nearest 5. However, what they should also be showing is some indication of the
accuracy: +/- X.
It's pretty obvious that there is a big difference in presentation: the first two not only show the position (Stand) on the 1st of April each year but also the number of births (geboorte) and deaths (sterfte). The last one doesn't show the births and deaths but also shows the numbers on the 1st of May rather than the 1st of April. This starts to make a comparison with the first two years a bit tricky especially as in some years hundreds of animals are shot after the first of April.
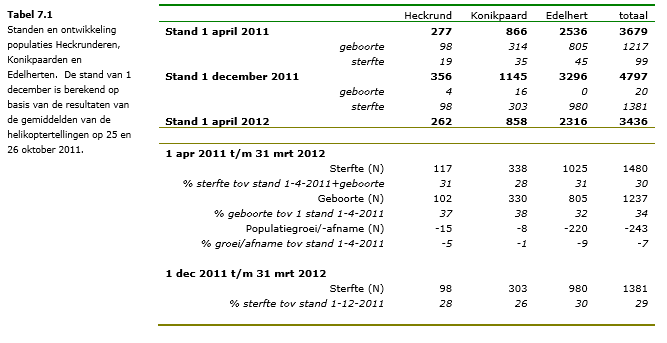
There is also something about the first two reports that is troubling us: in the report made in 2011 the number of cattle, horses and deer on 1st April 2011 are given respectively as 305, 988 and 1886 but in the report made in 2012 they are given as 277, 866 and 2536. We can't find any explanation in the reports to explain this. Perhaps it is mentioned in one of the references given at the end, but in our opinion it's not reassuring that it's not addressed within the main body of the report. These reports are the main source of information for the public and other stakeholders in the OVP, so the information given should be clear and easily accessible.
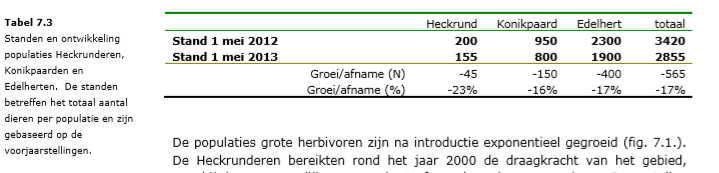
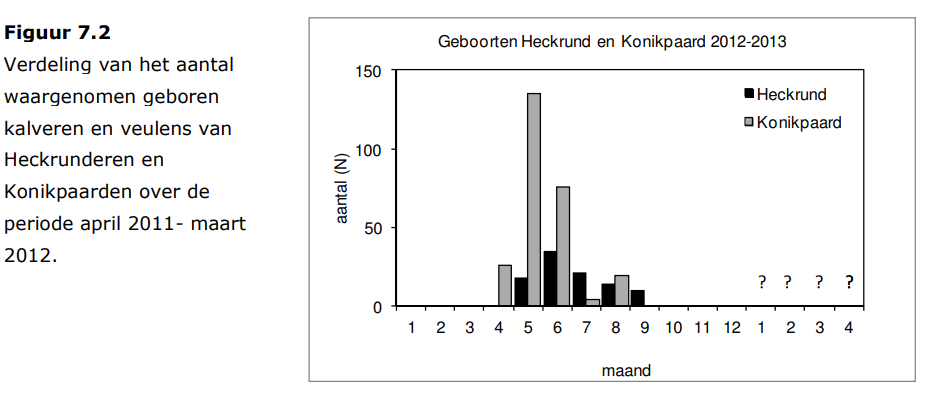
We are also troubled by the difference between the figures given for spring 2012: in the report from 2012 they are given for the 1st April 2012 as cattle 262, horses 858 and deer 2316. The 2013 report gives figures for the 1st May 2012 as cattle 200, horses 950 and deer 2300. That would mean a net loss (births and deaths) of over 60 for the cattle and a net gain (births and deaths) of about 90 for the horses. The information on births in the 2013 report is shown below:
This figure shows the births of the cattle and horses that were counted (the title of the figure mentions April 2011 - March 2012, but it's clear from the report and the heading of the figure that it actually refers to 2012-2013). We're interested in the month of April 2012 and you can see that there were no cattle (Heckrund) born in that month while approximately 20/25 horses (Konikpaard) were born. That's far short of the 90 foals that we would expect to explain the difference between the 2012 and 2013 reports.
And what about the deaths? Here's the figure from the 2013 report showing the total number of deaths per month starting in April 2012:
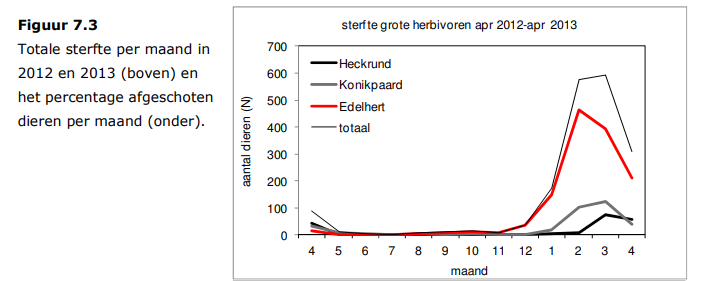
Does that really show that 60 cattle (Heckrund) died in April 2012? We don't think so. But if it does, then almost the same number of horses (Konikpaard) died too, which makes the discrepancy between the 1st April 2012 and 1st May 2012 figures shown in the report even greater.
The conclusion that we draw from this is that the available reports up to the report of 2013 don't give enough information to have confidence in the figures given from year to year.
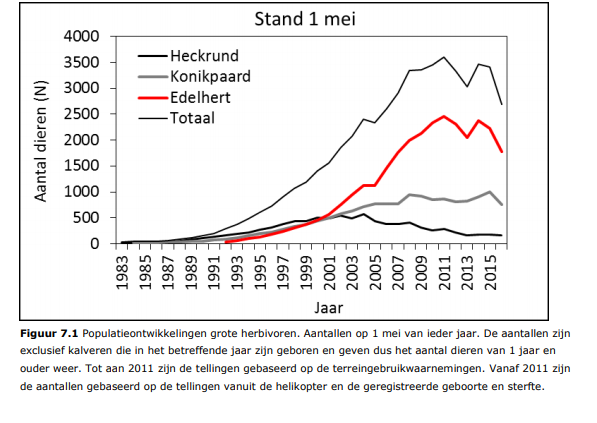
In the 2013 report we see the introduction of a new way of showing the population: a graph that shows the population excluding calves and foals born that year, so only the adult population over one year old, on the 1st of May for a number of years. Here it is:
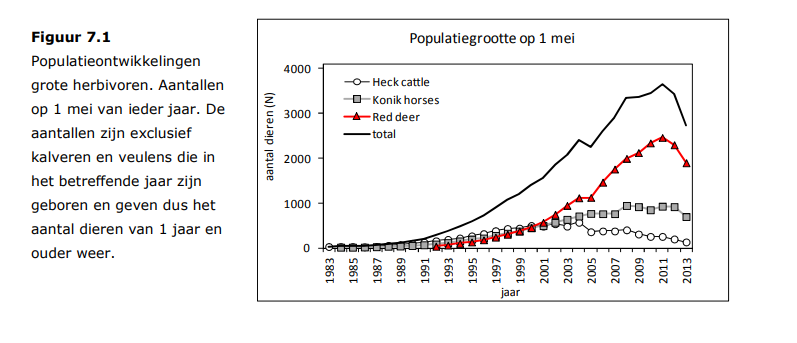
Well, that certainly sorts out the unjustified precision problem doesn't it? We can't guess the number of animals closer than about 50: can you do any better? It's unfortunate that they don't include the numbers that they base this chart on.
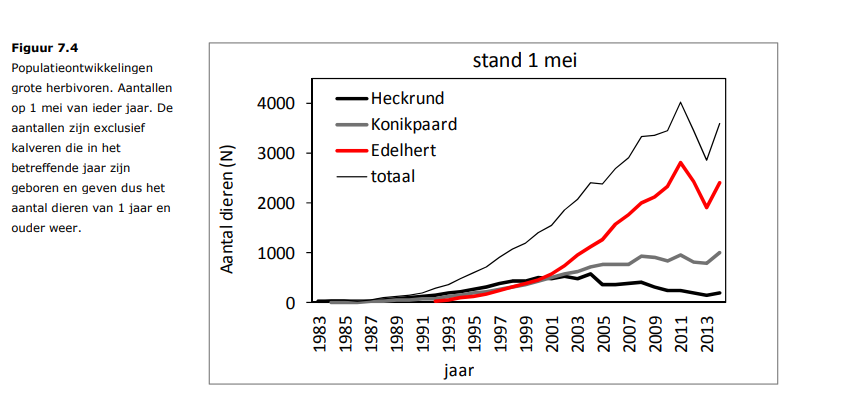
The following years the same format was used.
The 2014 report:
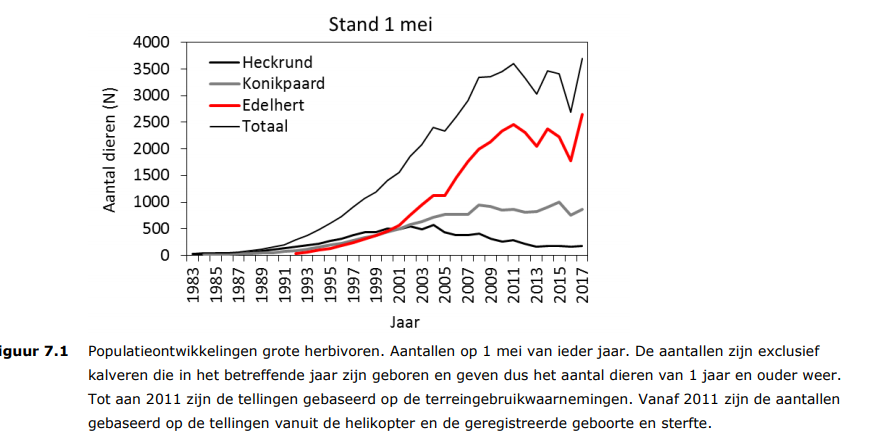
It's clear that these graphs don't really give much information: as the researchers acknowledge, it's difficult to get precise figures. In fact, the only figure that we can expect to be accurately counted is the number of animals that are shot each year. Everything else, from the total number of animals seen by helicopter survey or counted by ground survey, to the number of births and deaths registered is an estimate.
We've only shown the parts of the report that present the numbers in a way that allows comparison with one or more other years. The reports do show in some form or another the numbers of animals that are counted by the helicopter or ground surveys. They also show the number of births and deaths, but frustratingly in an inconsistant manner. For example, this is the data on the number of births each year for the period Jan-Dec taken from the 2014/15 report:
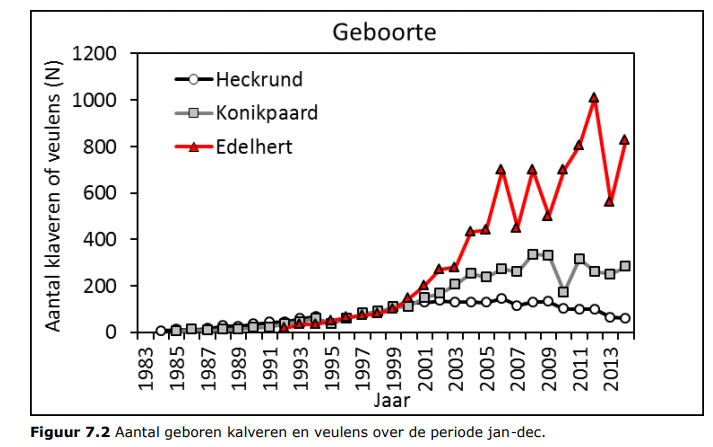
It isn't very easy to estimate the number for any particular year.
This is how the data for deaths is given in the same report:
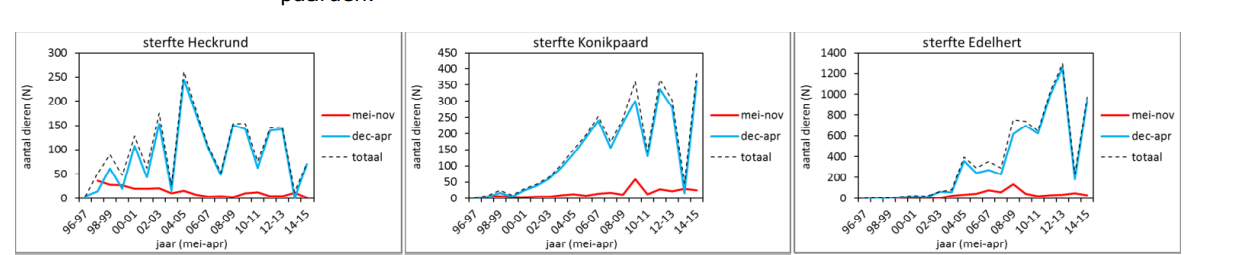
It shows the deaths over the period May-April. This makes it difficult to compare the number of births or deaths per year to see if the population is growing or falling. This difficulty is compounded by the main population growth graph only showing adults older than one year.
Conclusions
In our opinion, the figures shown are not helpful for obtaining an overview of what is happening in the OVP. It appears that the only precise and accurate figure that is known is the number of animals shot each year and even that is not consistently clearly presented. The other data such as registered births and deaths from other causes and the total number of animals are estimates. This is not a criticism of the methods used, but an acknowledgement of the difficulties involved in counting large numbers of animals in an open space.
So what can we know with certainty? One thing all the reports do have in common is that they show a large number of animals being killed every winter. However, there is no discussion as to whether this is comparable to animals in an unfenced area.
With less certainty, as it's difficult to tell from the charts, it appears that the population of cattle (Heckrund ) is declining. This is perhaps not surprising as the deer compete with them for their food. The deer are more adaptable as they can also eat other plant material. So if there is a shortage of the only food that the Heckrund can eat the deer will have more chances of finding something else to eat.
However, apart from considerations of what the data actually means, we have concerns about the choice of data and the way that the data has been presented over the years:
- using the estimated population on 1st May each year as the basis for the trend. IIUC these figures are based on the autumn helicopter survey to which are added the estimates of births and deaths for the period until 1st May the following year. This must introduce even more risk of inaccuracy. Why not use the helicopter survey results?
- the way that the date is presented within the reports is not always consistent. For example in the 2014/15 report the births are shown over the period Jan to Dec and the deaths over the period May to Apr. The births for all three animals are shown on one chart, the deaths separately in three with different scales.
- the data shown in the reports differs from year to year. Why have some elements been dropped? For example in both the 2013 and 2014 reports a section shows that the vast majority of deer that was shot were under one year old. This data is not shown in the subsequent reports. In 2011 the section on the large herbivores was 12 pages long: in the 2017 report it is not even three pages long.
Debate
There is a vigourous public debate about the situation of the grazers in the OVP. In our opinion the reports of the SBB do not give a complete and transparent view of the situation.
It seems from the conclusions of the latest report that the number of deaths of the grazers is not seen as a problem by the SBB. No solutions are put forward for reducing the number of deaths. In 2016, the report acknowledged that Ragwort (St Jakobskruid) has been spreading across part of the area for 10 years. The grazers don't feed in those areas so obviously the total amount of food available for them is getting less and less every year. What does the SBB suggest to do about it? Nothing.
The policy seems to be that this is OK because they are wild animals. In our opinion this is not a valid position: the cattle and horses are pseudo-wild animals that have been selectively bred from domesticated animals to ressemble wild animals. In addition, they are not in a natural environment: not only are they fenced in so that they can't migrate to areas of more abundant food, but the environment within the enclosed area is managed. The 2017 report lists a number of measures that are envisaged in order to improve the conditions of 19 of the 23 types of bird included in the Natura 2000 plan. The measures include a temporary lowering of the water level, construction of some pools with islands that the grazers cannot reach, raising the water level in part of the grassy area so that the grassland is periodically flooded. So the birds who are clearly wild have the area managed for their benefit, but the grazers who are not wild don't...
Ethics
It's clear that the way that the OVP is currently managed is responsible for the needless suffering and deaths of many animals. If this is a scientific experiment to see what happens to the grazers, then it's totally unethical, because it's obvious what the ultimate result is going to be. Because of their small populations the cattle and horses will become increasingly inbred and will die out relatively quickly. The deer will survive longer, but eventually the soil will become impoverished thanks in part to the loss of the biomass contained in the many tonnes of corpses that are removed each year. The carrying capacity of the land will fall, the population will become smaller and inbreeding will start to become a major issue. If this is the case then, not only for humane, but also for ethical reasons this unnecessary experiment which causes so much suffering and which wastes so much taxpayers' money should be halted.